

|Articles|October 14, 2015
Better Performance Metrics Needed for Radiology
Author(s)Diagnostic Imaging Staff
Performance data for radiologists significantly varies from nonradiologists.
Advertisement
Radiologists differ significantly in their performance metrics from other specialties, but more specialty-specific metrics are needed for better physician participation in programs, such as the CMS Physician Compare Initiative, according to a study published in the
Researchers from the Langone Medical Center in New York, NY and the Harvey L. Neiman Health Policy Institute, Reston, VA, sought to characterize and compare the performance of radiologists in Medicare’s new Physician Compare Initiative with that of other provider groups.
The researchers obtained publicly reported metrics from the CMS Physician Compare Initiative data; there were 900,334 health care providers listed, 30,614 of whom were radiologists. Comparisons were made among eight provider categories:[[{"type":"media","view_mode":"media_crop","fid":"42347","attributes":{"alt":"metrics","class":"media-image media-image-right","id":"media_crop_6910934931804","media_crop_h":"0","media_crop_image_style":"-1","media_crop_instance":"4567","media_crop_rotate":"0","media_crop_scale_h":"0","media_crop_scale_w":"0","media_crop_w":"0","media_crop_x":"0","media_crop_y":"0","style":"height: 104px; width: 150px; border-width: 0px; border-style: solid; margin: 1px; float: right;","title":"©Bloomua/Shutterstock.com","typeof":"foaf:Image"}}]]
• Radiologists
• Pathologists
• Primary care
• Other medical subspecialists
• Surgeons
• All other physicians
• Nurse practitioners and physician assistants
• All other nonphysicians
The results showed that overall radiologist satisfaction of all six metrics was significantly different among radiologists than nonradiologists:
Metric
Radiologists
Nonradiologists
Acceptance of Medicare-approved amount as payment in full
75.8%
85.0%
Electronic prescribing
11.2%
25.1%
Physician Quality Reporting System (PQRS)
60.5%
39.4%
Electronic health record participation
15.8%
25.4%
Receipt of the PQRS Maintenance of Certification program incentive
4.7%
0.3%
Million Hearts initiative participation
0.007%
0.041%
“Among provider categories, radiologists and pathologists demonstrated the highest and second-highest performance levels, respectively, for the two metrics (PQRS and MOC) with specialty-specific designs, but they ranked between fifth and eighth in all remaining non–specialty-specific metrics,” the authors wrote.
“The performance of radiologists and pathologists in Medicare’s Physician Compare Initiative may relate to the extent to which metrics are tailored to the distinct aspects of their practices as diagnostic information specialists,” they concluded.
Advertisement
Related Content
Advertisement


Advertisement
Advertisement
Trending on Diagnostic Imaging
1
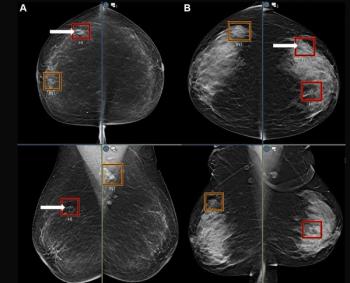
Mammography Study Suggests AI Can Bolster the Ability of General Radiologists to Detect Breast Cancer
2
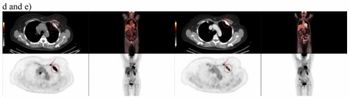
Study Suggests FDG-PET Better than CT for Assessing Treatment Response for Metastatic Breast Cancer
3
A Closer Look at the Evolution and Emerging Insights with Amyloid and Tau PET for Dementia and Alzheimer’s Disease
4
AI in Neuroradiology: Keys to Workflow Integration, Governance, and Facilitating Improved Outcomes
5