
|Articles|May 1, 2006
Dynamic contrast-enhanced MR imaging finally comes of age
Tumors require new blood vessels in order to grow beyond a few millimeters in size. Once this "angiogenic switch" is thrown, a series of events occur that lead to the progression and spread of cancer. The vessels formed by tumors are not only larger and more numerous but also more permeable than normal vessels1 (Figure 1). Thus, when a patient with a tumor is injected with a gadolinium-chelate MR contrast agent, the tumor enhances more than the surrounding normal tissue.
Advertisement
Tumors require new blood vessels in order to grow beyond a few millimeters in size. Once this "angiogenic switch" is thrown, a series of events occur that lead to the progression and spread of cancer. The vessels formed by tumors are not only larger and more numerous but also more permeable than normal vessels1 (Figure 1). Thus, when a patient with a tumor is injected with a gadolinium-chelate MR contrast agent, the tumor enhances more than the surrounding normal tissue.
Intuitively, radiologists understand that enhancement within a tumor is related to blood flow and vascular permeability. But a single snapshot image, such as a single-phase contrast-enhanced brain MRI, can support only a subjective guess as to the vascularity of the lesion.
In some diagnostic settings, the ability to estimate vascularity is critical. Assessment of enhancement at several time points is needed, for example, in the distinction of hemangiomas from metastases on multiphase liver imaging studies. This limited dynamic study cannot be used to quantify the lesion's vascularity but is nonetheless useful for diagnosis.
Quantification of lesion vascularity is a more difficult problem. Tumor enhancement is related to extrinsic factors, including contrast dose, the rate of administration, and cardiac output, as well as intrinsic factors such as the tumor's vascular volume, blood flow, and permeability. It is possible to compensate for these extrinsic factors and thus, isolate the intrinsic vascularity of the tumor by obtaining a series of dynamic scans before, during, and after administration of contrast media.
Dynamic contrast-enhanced MRI offers a way to quantify blood flow and permeability within a tumor. It can be useful for diagnosis, as in the case of breast and prostate cancers, and may also be beneficial for monitoring the effects of therapy directed against angiogenesis.
DCE-MRI has been performed in research settings since the late 1980s. The method has been applied in tens of thousands of patients worldwide.
In a DCE-MRI study, the patient receives a bolus of intravenous contrast media (typically a gadolinium chelate 0.1mmol/kg) administered using a mechanical injector. The scans consist of 3D spoiled gradient-echo images with short echo times, so that rapid 3D acquisitions can be acquired with a reasonable matrix size (e.g., 200 x 256) and in a reasonable time (five to 15 seconds per 3D acquisition). These sequences are similar to those used for MR angiography.
Because of the limited field-of-view, the tumor of interest is first localized, and then the 3D acquisition is centered on the lesion. A T1 "map" is obtained prior to injection and then scanning continues before, during, and after the injection of contrast media. The typical study takes five to 10 minutes to complete. Modern scanners easily accommodate this large amount of imaging data, typically more than 500 images per study, and can display the data in cine mode.
Once injected, the contrast arrives at the tumor and enters its vascular space through its arterial supply. It then leaks from the vascular space into the extravascular space, which surrounds the tumor cells. Over a period of time, the contrast leaks back into the vascular space and exits the tumor via the veins (Figure 2).
By measuring the signal arising from the tumor, an increase in signal (wash-in) followed by a decrease in signal (wash-out) can be observed. If one plots the curve of signal intensity versus time (Figure 3), one can visualize the enhancement process and the temporal characteristics of the wash-in and wash-out phases. Tumors typically have rapid wash-in and wash-out, while normal and benign tissues demonstrate slower wash-in and may not even begin to wash out during scanning.
The enhancement curves generated by DCE-MRI reflect the total amount of contrast material in a tumor at each time point. They are the result of two processes: flow of contrast material in and out of the vessels that perfuse the tissue (perfusion), and exchange of the contrast material between the intra-and extravascular spaces (permeability).2 The magnitude and rapidity of these two processes, and the sizes of the vascular and extravascular spaces, are of diagnostic and prognostic value since they differ among tissue types and change as tumors respond to therapy. For example, in the case of MR of the breast, qualitative assessments were predictive of cancer in many but not all cases.3 However, standardized and quantitative assessments are less subjective and, therefore, presumably more reliable.
ANALYZING THE DATA
In DCE-MRI, these parameters cannot be measured individually but are estimated indirectly by means of a well-accepted mathematical model. The parameters generated from the model are estimated by finding the values that produce a curve that best fits the observed enhancement data.
The "two compartment" model commonly used to analyze DCE-MRI posits an intravascular and extravascular compartment and describes the passage of contrast material within these spaces in terms of two parameters, Ktrans and kep. Ktrans relates to the ease of exchange between the intra- and extravascular spaces. As a result, its magnitude reflects the rapidity of forward leakage rate into the extravascular space. A low Ktrans is reflected in an enhancement curve of low overall magnitude.4 Kep reflects the rapidity with which the contrast leaks back into the intravascular space. The lower the kep, the longer the contrast remains in the extravascular space and the more prolonged the wash-out phase of the enhancement curve.
Before analyzing the tumor's DCE-MRI intensity curve, and estimating from it the tumor's Ktrans and kep, two additional pieces of critical information must be obtained. The first is the time course of the contrast bolus that enters the tumor through its arterial supply: the so-called input function. The input function can be obtained by measuring the signal from an artery in the vicinity of the tumor. Inclusion of the input function is necessary since the DCE-MRI curve is dependent not only on the tumor's vascularity but also on the input function.
Previous methods of analyzing DCE-MRI data obviated the need to directly measure the arterial input function by making assumptions about its amplitude and shape. However, this can lead to substantial reproducibility errors as the input function varies considerably from injection to injection and patient to patient. Another consequence is that occasionally, physiologically implausible results are obtained due to assumptions that prove inaccurate.
The second piece of critical information is the native T1 of the target tissue. This is needed because the relationship between gadolinium concentration and the signal intensity on MR is dependent upon the baseline T1. This is different from CT scanning, in which a fixed relationship exists between iodine concentration and Hounsfield units regardless of the baseline attenuation.
Thus it is necessary to obtain a T1 map prior to injection.5 This allows the conversion of MR signal intensity curves to gadolinium concentration curves-the proper basis of the analysis of the tumor's enhancement characteristics-and standardizes the analysis of DCE-MRI.
Although these models sound complex, concentration curves and the estimation of Ktrans and kep from them can be quickly obtained using a PC, provided the appropriate analysis software is available. Fortunately, such software is becoming widely available. Using these measurements also enables assessment of a valuable parameter, the area under the gadolinium curve, which has been used instead of Ktrans and kep in some studies.
Faced with all these requirements, it would not be unreasonable for nonacademic radiologists to shrug off this technique as a research tool with no impact on daily practice. In fact, evidence supports the idea that a subjective reading of the kinetic contrast curve is predictive at least in the case of breast cancer.3 There are several reasons why radiologists should consider adding it to their menu.
Oncologists are searching for functional imaging methods capable of judging response to drugs early in the course of therapy, before entire cycles of drugs are administered. It is senseless and wasteful to continue treating a patient with a drug that is doing no good and may be doing harm. Third-party payers are increasingly demanding evidence that a treatment is working before sanctioning continued use. Finally, with more drugs at their disposal, oncologists are increasingly interested in customizing therapies to individual patients.
Intense attention is being paid to imaging tests that can reliably detect changes in tumor physiology, particularly before alterations in tumor size can be observed.6 Such methods are also being used by the pharmaceutical industry to assess the impact of drugs in early phase clinical trials.
OBSTACLES TO ROUTINE USE
DCE-MRI has become a standard method for evaluating breast nodules and has been accepted in the general radiologic community. Breast cancer is particularly well suited to DCE-MRI because background tissue enhances poorly. Although DCE-MRI has been performed for at least 15 years, it is not in routine use for all tumors in imaging centers. One reason is that evaluation of angiogenic inhibitors has only recently become important. Another is that several technical advances necessary for efficient implementation of DCE-MRI are relatively new. These include motion compensation methods such as navigator echoes.7 In addition, critical analytic tools, once the province of MR physicists, are now available for average end users. Such tools allow more accurate tracking of the arterial input function and calculation of the gadolinium concentration curve.
The primary barrier to widespread use of DCE-MRI is the lack of a generally acknowledged clinical application outside the breast. But that is changing, and the need for clinical DCE-MRI is growing in tandem with the increasing numbers of angiogenic inhibitors approved by the FDA. Implementation has also been hampered by lack of reimbursement by third-party payers and the categorization of DCE-MRI as an off-label use of contrast media.
The utility of DCE-MRI must be demonstrated in large multicenter trials. Most studies of DCE-MRI are performed at one or two institutions, which is inadequate to convince regulators of the technique's value. To remedy this situation, multicenter studies that employ a variety of platforms but use a common reporting scheme are under way. Pharmaceutical companies and the NCI are currently funding such trials.
Another barrier is confusion about the meaning and value of Ktrans and kep as generated by two compartment models. Clearing up this confusion has been made even more difficult by the lack of a common lexicon that describes the parameters and the models used to generate them.
The acquisition and analysis of DCE-MRI has been a cottage industry for many years. As a result, it is not uncommon for groups to be unable to compare results because a common approach is lacking. Standardization is needed if DCE-MRI results are to be reliable and comparable among institutions. A consensus conference held in 2004, sponsored by the National Cancer Institute, sought to forge an agreement on common terms and methodologies for DCE-MRI.8 The results are published online and will soon be available as a publication.9 This consensus will encourage standardization of terminology and acquisition parameters and greatly spur efforts to implement DCE-MRI in the community.
One additional barrier to implementation is inadequate training of technologists in performing DCE-MRI and lack of built-in protocols by vendors. We have found this to be readily surmountable, however. At the National Institutes of Health, we have performed more than 1000 DCE-MRI studies, and it has become routine. New technologists quickly learn how to perform a DCE-MRI, and most of our technologists believe this test poses no special difficulties.
One step in the right direction has been the recent adoption by manufacturers of a standardized analysis platform. The ease of performance of DCE-MRI has been greatly aided by the development of such standardized tools. GE Healthcare and Philips Medical Systems have developed DCE-MRI analysis tools based on the same mathematical models (Figure 4). Discussions with Siemens are in progress.
The analysis tools differ only in their graphical user interface but are not substantively different computationally. The technologist simply loads the DCE-MRI image set into the software, identifies the arterial input vessel and the target lesion, and the tool generates color maps of Ktrans and kep (Figures 5, 6). These tools will allow the development of a standard means of communicating results, which could have a beneficial impact on increased clinical use.
While DCE-MRI is in the process of validation, the technical landscape is not standing still. New contrast agents are being introduced that may increase the value of the technique. One of the central limitations of low-molecular-weight contrast agents is that they leak readily from the vasculature. Thus, blood flow is difficult to distinguish from permeability. Larger molecular-weight contrast agents (which are under development for MR angiography applications) may have decreased leakage and, therefore, may more accurately depict blood flow than existing agents.10 The pace at which macromolecular contrast agents are being approved is disturbingly slow, but it is expected that these agents will soon be available.
DCE-MRI is a functional imaging technique whose time has come-now that the technical hurdles of rapid scanning and uniform, easily applicable analytic tools have been overcome. The success of DCE-MRI in the diagnosis of breast cancer should serve as a model for extending this method to other tumors and other settings. DCE-MRI is accessible to most radiology departments in the U.S. at a reasonable price. It does not require radiation, is substantially less expensive and potentially more reimbursable than FDG-PET, and provides anatomic in addition to functional information. The technique can be combined with other MR-based functional techniques, such as spectroscopy and diffusion-weighted imaging, as well as standard high-resolution imaging.
Some important steps need to be taken before DCE-MRI is a common imaging test. These include demonstrating its utility in multicenter trials that use a variety of platforms and acceptance by third-party payers and regulatory agencies such as the FDA. After a long adolescence, DCE-MRI is finally coming of age.
Dr. Choyke is program director of the molecular imaging program and Drs. Barrett and Ocak are clinical researchers at the National Cancer Institute in Bethesda, MD; Drs. Dwyer and Thomasson are on staff in the department of diagnostic radiology of the Warren Grant Magnuson Clinical Center at the National Institutes of Health. Dr. Choyke has received research support from Philips, GE Healthcare, and Siemens.
References
1. McDonald DM, Choyke PL. Imaging of angiogenesis: from microscope to clinic. Nat Med 2003;9:713-725.
2. Choyke PL, Dwyer AJ, Knopp MV. Functional tumor imaging with dynamic contrast-enhanced magnetic resonance imaging. J Mag Res 2003;17:509-520.
3. Schnall MD, Blume J, Bluemke DA, et al. Diagnostic architectural and dynamic features at breast MR imaging: multicenter study. Radiology 2006;238:42-53.
4. Tofts PS, Brix G, Buckley DL, et al. Estimating kinetic parameters from dynamic contrast-enhanced T1-weighted MRI of a diffusable tracer: standardized quantities and symbols. J Mag Res 1999;10:223-232.
5. Evelhoch JL. Key factors in the acquisition of contrast kinetic data for oncology. J Mag Res 1999;10:254-259.
6. Kelloff GJ, Krohn KA, Larson SM, et al. The progress and promise of molecular imaging probes in oncologic drug development. Clin Cancer Res 2005; 11:7967-7985.
7. Padhani AR, Neeman M. Challenges for imaging angiogenesis. Br J Radiol 2001;74:886-890.
8. Evelhoch J, Garwood M, Vigneron D, et al. Expanding the use of magnetic resonance in the assessment of tumor response to therapy: workshop report. Cancer Res 2005;65:7041-7044.
9. Recommendations from 2004 NCI workshop (pdf). http://imaging.cancer.gov/images/Documents/14a39040-dad1-46f8-bf88bae2e7401ebe/DCE_RecommendationfromNov2004NCIWorkshop(2).pdf
10. Kobayashi H, Brechbiel MW. Dendrimer-based macromolecular MRI contrast agents: characteristics and application. Mol Imag 2003;2:1-10.
Advertisement
Related Content
Advertisement


Advertisement
Advertisement
Trending on Diagnostic Imaging
1
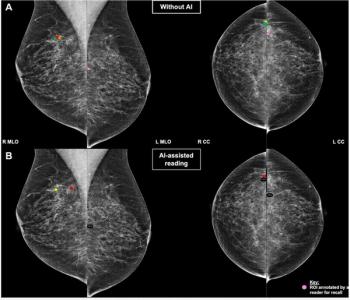
Mammogram Interpretation and AI Automation Bias: What New Research Reveals
2
Breast Imaging in Focus: Can Automated Breast Ultrasound Have an Impact in Screening for Women with Dense Breasts?
3
Six Key Considerations on Aortic Dissection for Radiologists
4
SCCT: Pre-Pregnancy CAC Associated with Threefold Higher Risk of Preeclampsia
5