
|Articles|January 26, 2021
Multi-Parametric CT Offers Earlier Detection for Common Liver Disease
Author(s)Whitney J. Palmer
CT can provide faster, easier-to-capture evidence of non-alcoholic fatty liver disease than MRI or ultrasound elastography.
Advertisement
Non-alcoholic fatty liver disease (NAFLD) is rapidly becoming the most common cause of liver disease worldwide, and multi-parametric CT can be an effective way for providers to identify which patients have the condition.
With NAFLD affecting roughly 25 percent of adults across the globe – and nearly a quarter of those individuals progressing on to non-alcoholic steatohepatitis (NASH), a precursor to cirrhosis – finding a strategy that can pinpoint patients who could benefit from treatment is critical.
In an article published Jan. 22 in the
Related Content:
“CT is a highly accessible, frequently used method for assessment of patients with NAFLD and identification of those with high-risk NAFLD (advanced fibrosis or cirrhosis) who are potentially most in need of intervention,” said the team led by Meghan G. Lubner, M.D., professor of radiology in the abdominal imaging section at Wisconsin.
The use of multi-parametric CT fills a void, the team said. Both MR and ultrasound elastography techniques has been successful in measuring liver stiffness as a surrogate for fibrosis. But, they come with obstacles – not only do they require a significant level of expertise, but they also are not used much in the clinical setting. In contrast, non-invasive CT biomarkers are frequently used clinically to diagnose liver disease and hepatic fibrosis.
For this study, Lubner’s team focused specifically on identifying patients with high-risk NAFLD. In a single-institution retrospective cohort study, they looked at CT images captured on 16-to-64-MDCT scanners within a year of liver biopsy from 186 patients with the condition. Most images were contrast-enhanced.
Of the group, 87 individuals had NASH, and 112 had moderate-to-severe steatosis. For fibrosis stages, 51 were F0, 42 were F1, 23 were F2, 37 were F3, and 33 were F4. A group of 70 individuals – 38 percent – had advanced fibrosis and high-risk NAFLD.
Based on the team’s analysis, the Fibrosis-4 (FIB-4) index score correlated with fibrosis with ROC AUC of 0.75 for identifying high-risk NAFLD. In addition, the CT parameters liver segmental volume ratio and splenic volume performed best – they both had an AUC of 0.69 for detection of the condition.
“Patients with a high FIB-4 score and CT findings of advanced fibrosis may no longer need biopsy for confirmation,” the team said. “Therefore, use of FIB-4 and CT together may reduce the need for invasive testing.”
Overall, however, they explained, reader assessment – a subjective cognitive combination of the measured features by trained readers – was the highest performing parameter with an AUC of 0.78 and 0.79 for both readers. Performance by the readers revealed a good association with the presence of advanced fibrosis.
While CT performed well for NAFLD detection, it was underwhelming for picking up on evidence of NASH. According to the team, all single imaging parameters, including subjective reader assessment, performed poorly.
For more coverage based on industry expert insights and research, subscribe to the Diagnostic Imaging e-Newsletter
Advertisement
Related Content
Advertisement


Advertisement
Advertisement
Trending on Diagnostic Imaging
1
Six Key Considerations on Aortic Dissection for Radiologists
2
SCCT: Pre-Pregnancy CAC Associated with Threefold Higher Risk of Preeclampsia
3
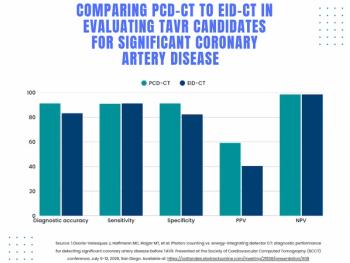
Early Intervention for Coronary Artery Disease and the Role of Photon-Counting CT
4
Competitive Eating: A New Niche for Radiologists?
5