

|Articles|July 29, 2014
Radiology Utilization in Emergency Departments Declines
Author(s)Diagnostic Imaging Staff
Use of imaging studies in emergency departments rose significantly from 1993 to 2007, but then declined from 2007 to 2012.
Advertisement
After a steady increase for 14 years, imaging in the emergency department (ED) has declined since 2007, according to an article published in the
Researchers from Brigham and Women’s Hospital in Boston, Mass., undertook a retrospective study to assess radiology trends for emergency departments from 1993 to 2012.
The study involved the radiology utilization at a 793-bed quaternary care academic medical center, which had a 28 percent increase in number of ED patient visits during the study period from 47,635 in 1993 to 60,957 in 2012. The researchers included all adults who presented to the ED and collected data on imaging performed only by radiologists: CT, MRI, sonography, conventional radiography and others, such as interventional radiology, nuclear medicine and angiography.
A total of 1,058,661 imaging studies were performed on 1,077,057 patients during the study period:
1993–2012
CT
314,604
MRI
48,79
Sonography
68,090
Radiography
601,145
Other
26,031
“The total imaging RVUs [relative value units] increased 267 percent from 13,185 in 1993 to a peak of 48,474 in 2007 and then decreased 19.2 percent to 39,167,” the authors wrote. There were 40,959 studies in 1993 and 68,178 studies in 2007, which is an increase of 66.5 percent. The numbers then began to decline by 17.0 percent to 56,617 studies in 2012.
The results showed CT RVUs were 85.8 per 1,000 ED visits in 1993. This rose to a peak of 508.6 visits in 2007, but then dropped to 338.8 in 2012. MRI RVUs showed a similar peak and decline, with 5.9 per 1,000 visits in 1993, 151.9 in 2008, and then 120.6 in 2012.
Ultrasounds rose from 44.0 RVUs per 1,000 visits in 1993 to 77.3 in 2012, but radiographs showed a steady decline over the full study period, dropping from 141.2 RVUs per 1,000 visits in 1993 to 101.5 in 2012.
The net effect from the beginning of the study period to the end is equivalent to a 5.6 percent increase in RVUs per year and a 1.6 percent increase in accession numbers per year. However, visits increased at a rate of 1.2 percent per year.
The authors concluded that ED imaging RVUs declined after 2007 following a substantial increase in imaging from 1993 to 2007.
Advertisement
Related Content
Advertisement


Advertisement
Advertisement
Trending on Diagnostic Imaging
1
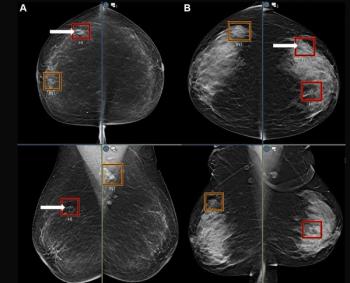
Mammography Study Suggests AI Can Bolster the Ability of General Radiologists to Detect Breast Cancer
2
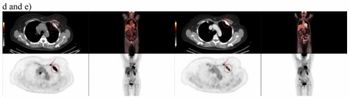
Study Suggests FDG-PET Better than CT for Assessing Treatment Response for Metastatic Breast Cancer
3
A Closer Look at the Evolution and Emerging Insights with Amyloid and Tau PET for Dementia and Alzheimer’s Disease
4
AI in Neuroradiology: Keys to Workflow Integration, Governance, and Facilitating Improved Outcomes
5