
|Articles|June 5, 2012
Software Customizes CT Dose Monitoring
Author(s)Whitney L. Jackson
The RADIANCE Toolkit, an open-source program developed by Tessa Cook, MD, PhD, and colleagues allows facilities to create customized dosing tables and reports.
Advertisement
Responsibility for collecting and analyzing radiation dose information falls to individual practices and facilities. There are several software packages currently available that allow you to monitor your dosing levels, but they often limit the ways you can study and present your data.
To address that limitation, Tessa Cook, MD, PhD, a radiology research resident at the Hospital of the University of Pennsylvania in Philadelphia, and several colleagues have developed the RADIANCE Toolkit, a free, open-source dashboard program that allows imaging facilities to create customized dosing tables and reports that fit their needs. This project was selected as one of the Top 5 Medical Imaging IT Projects of 2012 in an annual juried competition, co-sponsored by the Society for Imaging Informatics in Medicine (SIIM) and the Radiology Business Journal. She will be introducing her solution at
Diagnostic Imaging spoke with Cook about how the toolkit differs from other dose monitoring tools and what benefits it can provide.
How is RADIANCE Toolkit different from other dashboard programs?
The RADIANCE [Radiation Dose Intelligent Analytics for CT Examinations] Toolkit is a fairly basic, simple interface designed to give users the ability to generate customized reports about the data they collect. It is different from the existing RADIANCE dashboard, which has preset screens, including predefined reports that can be adjusted to individual studies of interest. As we continued through development, we heard from practices that they wanted to be able to compare dose estimates by variables, such as weight and age. We realized there was a need for customization so the user could decide individually what he or she wanted to look at and how. Rather than giving users six ways to look at data, we researched how to put multiple abilities in users’ hands.
The SIIM abstract states the RADIANCE Toolkit makes dose monitoring easier. How is this accomplished?
In the past, it took multiple steps to develop queries. You’d have to do the nuts and bolts to develop them yourself, making sure you had the right results. Then, you had to export the data to a spreadsheet and manipulate it there. The toolkit uses HighCharts, a full-featured JavaScript graphing library and jQuery, a JavaScript library that allows for many interactive tasks. It really makes data much more accessible for when users have specific questions about what’s going on with a particular scanner or study. You have actual chart options, such as scatter plots, that aren’t an extension of a spreadsheet, and it gives you the ability to more easily build queries and export the data into tabular or graphical formats.
How does the RADIANCE Toolkit dashboard make customization available?
Everything in the toolkit is Web-based. A user simply opens up a browser, pulls up the toolkit page, and chooses variables from a set of pull-down menus. In most cases, users will be looking at radiation dose estimates, and they can select which variables they want to include, such as patient weight or scanner type. For example, users can analyze patient dose estimates by scanner and by body mass index. They can also choose other comparison features within the data. In addition, they can choose to display the data in a scatter plot or in other types of charts. It’s also possible to export charts as PDFs or PNG files. The toolkit also lets facilities compare their scanners and identify if particular ones have higher dosing levels based on a variety of patient values, such as size, weight, or body mass index. That information can help them make any appropriate changes.
Are there examples of things the RADIANCE Toolkit can do that others cannot?
The most important thing is really that it makes the data much easier to manipulate and interpret. Rather than having large quantities of data that you have to make sense of offline, you can do this in real time with the data you’ve collected over a shorter or longer time span. It’s a flexible system that gives data more meaning. Looking at something graphically provides more context than a stream of numbers in a table. Over the last few years, people have come to us and asked, “Can we do this or that?” The answer has always been, “Not yet, but with the toolkit, you will.” That gave us the motivation to develop a toolkit that gives users the ability to do all kinds of analyses that fit their needs rather than being constrained by a predetermined set of variables and options.
What will the RADIANCE Toolkit change or improve for a practice or facility?
It’s more of a patient care improvement tool, rather than a work flow tool. It’s a more behind-the-scenes analysis tool. Those in an office who are more focused on improving quality will use it rather than the radiologists who spend their days interpreting studies. The toolkit is designed for people who monitor dose estimates and protocols over time, looking for trends and opportunities to reduce risk. Protocols need attention, and the toolkit gives these individuals access to data without having to wade through a database query that isn’t familiar or look through a large manifest of data. They can figure out what they’re interested in, study it separately, systemically review protocols, and the make changes.
Advertisement
Related Content
Advertisement


Advertisement
Advertisement
Trending on Diagnostic Imaging
1
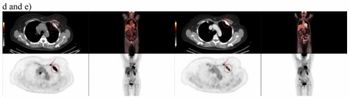
Study Suggests FDG-PET Better than CT for Assessing Treatment Response for Metastatic Breast Cancer
2
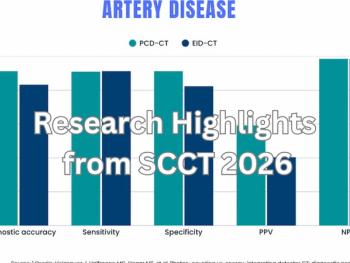
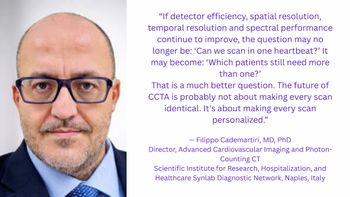
Research Highlights from SCCT 2026
3
A Closer Look at the Evolution and Emerging Insights with Amyloid and Tau PET for Dementia and Alzheimer’s Disease
4
New Radiology Platform Facilitates Remote Access to Imaging and Collaboration
5