Dashboards shift PACS management into overdrive
At about 10:30 on a busy weekday morning, the PACS administrator's cell phone begins ringing repeatedly. First two radiology technologists, then several radiologists-followed by the director of imaging-call, all complaining of miserably slow network response time. The PACS administrator dispatches an assistant who appears in the radiology department with a stopwatch and clipboard to make firsthand calculations.
At about 10:30 on a busy weekday morning, the PACS administrator's cell phone begins ringing repeatedly. First two radiology technologists, then several radiologists-followed by the director of imaging-call, all complaining of miserably slow network response time. The PACS administrator dispatches an assistant who appears in the radiology department with a stopwatch and clipboard to make firsthand calculations.
Such are the network management tools traditionally available to PACS administrators to diagnose PACS performance issues. When armed only with these anachronistic tools, PACS administrators, who work under constant demands for rapid image access and minimal downtime, are inadequately equipped even to determine whether the problem is a PACS performance issue or a bottleneck in the hospital network infrastructure. Plus, the onus of problem reporting is placed inappropriately on busy end-users. Even worse, stopwatch performance management leaves PACS support teams scurrying through corridors reacting like first responders to endless firestorms, unable to predict or prevent network performance problems. PACS vendors have historically provided few solutions that let system administrators promptly and accurately diagnose problems or relieve network bottlenecks.
The digital dashboard has emerged as the tool of choice to understand and manage PACS and their associated networks. The dashboard concept appeared initially in academia, where luminary institutions were among the first to see the need for better visibility into large, unwieldy imaging systems.
"Without adequate evidence to prevent the blame game, performance problems might not be resolved in a reasonable time, if at all," said one digital dashboard pioneer, Paul Nagy, Ph.D., director of quality and informatics research and an assistant professor of radiology at the University of Maryland.
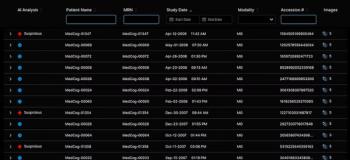
The digital dashboard provides system administrators with a straightforward means of monitoring resources such as equipment performance, storage utilization, and user volume. With a dashboard, PACS administrators can remain at their desks when verifying the status of any networked device. No more chasing through hospital corridors with a stopwatch.
Dashboards shift the role of system administrators from reactive to proactive by providing a way to monitor network resources. Dashboards can also automatically notify support staff via pager when problems occur. Before dashboards, PACS administrators were usually the last to learn of a crisis. Now, they are notified first, often before users even notice a problem exists.
PIONEER PACSPULSE
Nagy was one of the first to develop a radiology-specific dashboard. While at the Medical College of Wisconsin, Nagy debuted PACSPulse (pacspulse.sf.net), an open source application intended to provide visibility and analysis of PACS traffic, at the 2001 RSNA meeting.
"This tool was designed for PACS administrators working in a hospital environment trying to understand performance bottlenecks," Nagy said. "The goal was to make PACSPulse user-friendly, so it wouldn't take a DICOM-certified PACS engineer to understand what was going on."
The PACSPulse dashboard monitors and analyzes performance data from the perspective of the server, network, or workstation to identify bottlenecks. Charting tools provide concise reporting that can be understood at the CIO level.
While PACSPulse still exists, Nagy has moved on from Wisconsin and feels the system has not survived well.
"It's still out there, but it requires proprietary integration into a PACS, so there's no open standard to harness performance data," he said. "It's really just tied into a single vendor."
TWO IF BY UPMC
Like the Medical College of Wisconsin, researchers at the University of Pittsburgh Medical Center took monitoring matters into their own hands, only they designed two systems: the first, a clinical dashboard, in 2005, followed by an IT support dashboard in 2006. The clinical dashboard monitors system metrics such as workflow consolidation and distribution for rapid evaluation by a radiologist.
"Radiologists today are sitting at the controls of increasingly unmanageable digital workstations and lack tools to effectively manage and control them," said Dr. Matthew Morgan of the Division of Radiology Informatics at the Univer-sity of Pittsburgh Medical Center.
Dashboards can facilitate missing control through workflow consolidation. For instance, most workflow models require radiologists to remember to periodically break into routine workflow to check personal queues for unsigned reports.
"If radiologists forget to check or allow large numbers of studies to accumulate before signing, it adds unnecessary delay to report turnaround," Morgan said.
A PACS-integrated dashboard can address this problem by monitoring the unsigned report queue, producing alerts at predefined thresholds, then providing seamless entry to the report-editing system.
The UPMC clinical dashboard also helps radiologists prioritize workflow by monitoring the number of unclaimed studies at affiliated facilities and alerting users when the numbers surpass predefined thresholds.
Urgency evaluation is another component of the clinical dashboard. Because priority can be overlooked in the complexity of a multi-institutional PACS, a PACS-integrated dashboard component can monitor predefined, context-specific time limits for particular types of studies and produce alerts for users when these limits are exceeded, Morgan said.
UPMC grew its own rather than adopt one of the emerging commercial solutions, largely because of the complexity of its environment.
"The benefit of designing our own dashboard solution has been the ability to develop across software and hardware platforms," Morgan said. "Plus, while each vendor may have a dashboard solution for its individual products, none has the ability or incentive to monitor our complex configuration."
The UPMC dashboard is not portable, however.
Because many of the underlying systems, such as PACS, speech recognition, RIS, and the electronic hospital record, have not yet adopted modern service-oriented architectures, getting information from them into a central system like a dashboard application can be difficult and requires local programming expertise to accomplish, Morgan said.
"Plus, like most middleware, our dashboard is built to serve our appropriately idiosyncratic system configuration and workflow. These two issues combined make portability to other institutions unlikely," he said.
CONTINUED EVOLUTION
Academic medical centers continue to refine the dashboard concept, the latest iteration of which is RadMonitor (no relation to a radiation monitor of the same name by Medovation). Announced in May, this novel system monitors radiology operations, rather than network operations, by eavesdropping on HL7 and DICOM traffic, then parsing statistical operational information into a database. The data are then presented in the form of a treemap.
(Treemaps are unique visualizations of hierarchical data pioneered by University of Maryland computer scientist Ben Schneiderman, Ph.D., in the 1990s and perhaps best popularized by Smart-Money.com's Map of the Market.)
"RadMonitor extends the treemap construct into the hospital enterprise to support the analysis of radiology operations," said Richard Chen of Ohio State University. Chen and RadMonitor's research director, Dr. David S. Channin, chief of imaging informatics at Northwestern University, describe RadMonitor's real-time data mining potential in a recent paper (J Digit Imaging 2007 May 30; [Epub ahead of print]).
Unlike web-based solutions delivered through external plug-ins such as Java or Macromedia Flash, RadMonitor relies strictly on native, standards-based HTML, Extensible Markup Language, and Java Script.
"RadMonitor is the only solution we are aware of that exploits the recent advances in these technologies," Chen said.
The result is a product that delivers a web experience comparable to a native desktop application, he said.
RadMonitor is designed to help manage complex information flow in today's massive hospital networks by using proprietary or open source standards to interact and interface with other hospital information systems. HL7 and DICOM standards are critical to this process, Chen said.
"A surprising amount of analytical information is contained within HL7 and DICOM messages," he said.
The treemap is RadMonitor's centerpiece. The system currently supports three distinct treemaps: radiology orders, radiology staff, and specific radiologist. The specific radiologist treemap is the one most similar to the Map of the Market.
The radiologist treemap depicts radiologists' average dictation time. Treemap information is divided into a hierarchy of modalities and radiologists within a modality. The size of an individual radiologist's tree rectangle is related to the number of studies dictated by the radiologist. Correspondingly, the size of a modality's triangle indicates the total number of studies dictated within that modality, Chen said.
The color and color gradient of a radiologist's rectangle is a measure of the average time that radiologist spent dictating exams compared with the modality average.
COMMERCIAL SOLUTIONS
Commercial solutions tend to appeal to hospitals and imaging groups that have less time or interest in either designing or programming their own dashboard solution.
Some facilities also prefer the comfort of knowing the vendor is never far away. Borg Imaging in Rochester, NY, went with Carestream Health's digital dashboard in August.
"At my facility, we were already using Carestream for both PACS and RIS, so we had confidence that we would be receiving a quality product with follow-up support when necessary," said Shelly Wise, the RIS/PACS administrator at Borg.
Before the dashboard was installed, Wise would have to run system checks randomly throughout the day, trying to catch potential issues before they evolved into full-blown problems.
"Because there was no visual warning, an urgent issue-such as a system down-would not be caught in advance, causing disruption to workflow," she said.
The dashboard was also necessary because, as system administrator, Wise was expected to report on an assortment of data such as available storage and number of current web users.
"To find this information was not only cumbersome but time-consuming," Wise said.
Now, with the dashboard, she has constant, immediate access to not only statistical information but also internal processes.
"Because the dashboard is constantly running in the background, it gives me the time and confidence to focus on other tasks at hand," she said.
The Danish hospital Holbaek Sygehus is having similar success with the same commercial dashboard.
"We have had no server or system downtime since we installed our dashboard because we now can detect system malfunctions before a shutdown," said Dr. Torben Palner, the hospital's chief of radiology.
Palner said prior to implementing their dashboard, system malfunctions were usually discovered only when the system turned off, which interrupted radiologists in the middle of interpretation or dictation, sometimes requiring them to start over.
An enterprise-wide digital dashboard has been used at the NKI-AVL Hospital in Amsterdam for the past five years and has become so ingrained in the operation that users would be unpleasantly surprised if it disappeared, said Dr. Sara H. Muller, a physicist in the medical imaging department.
The current dashboard is run by the hospital's IT department and monitors more than the imaging environment at the 850-bed hospital with a large outpatient facility. They have recently started evaluating a Carestream Health digital dashboard system to see how it works in providing more information about systems being used by the imaging department.
To date, the review indicates that the Carestream system is more user-oriented, Muller said. Also, it makes available Carestream-specific information, such as the space available for tables, that is difficult to monitor in the generic system or with computers on a non-Windows platform.
Newsletter
Stay at the forefront of radiology with the Diagnostic Imaging newsletter, delivering the latest news, clinical insights, and imaging advancements for today’s radiologists.


