
|Articles|May 7, 2015
May the Match Be Ever In Your Favor
Author(s)Junzi Shi, MD
A new radiology resident reflects on the Match.
Advertisement
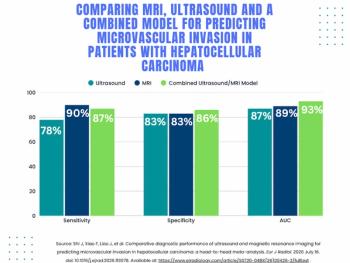
The main residency match for radiology this year had 680 U.S. applicants and 1141 total applicants apply for 999 advanced radiology residency positions. Fifty-five out of 166 radiology residency programs went unfilled. Of the matched residents, only 67.2% were U.S. grads. This is the lowest number of applicants for radiology in the last 15 years.
When choosing a specialty, studies have shown that students take into account personal loan debt, length of training, potential salary of the specialty, and work hours. Traditionally, radiology has been favorable in these categories and regarded as a specialty with good life-work balance, one of the “ROAD” specialties. Radiology has a medium length of training of four years, and the average salary is $351,000, as reported by the
Throughout the application process, I have heard comments from other medical students such as: “It’ll be too hard to find a job in the future. The salary of radiologists is on the chopping block. Radiology is becoming a purely informatics field. Patient care is going to decrease and machines are going to take over. Radiology is losing turf.” These were mostly generalizations and speculations; however, they did seem to make a large impact in the minds of potential applicants, and were cited as reasons not to choose radiology.
Overall, factors related to the decrease in applicants to radiology residency include current job market stagnancy, decreased future job security, and the specialty’s projected future. Decreased imaging utilization and increased applications of teleradiology in the last few years have changed the game. In the Medscape survey, 49% of radiologists said they would choose medicine again, and 52% would choose radiology again. The factors that lead to decreased satisfaction by professionals in the field are most likely also related to decreased number of applicants. The recession and stagnant growth since the 2009 recession have made new jobs hard to find and the struggle for turf more prominent. If we consider that overall unemployment rates were high as of December 2012 and that relative attractiveness of the field lags behind market strength by approximately two years, it makes sense that the 2014-2015 cycle of the Match coincided with the nadir of applicant interest.
As a student who just recently went through the Match process, I believe that applicants are influenced by three main factors: exposure to the field through shadowing and research, influence from upper level role models, and the projected future of the field. Promoting our specialty to more medical students and increasing the student exposure to the field are good ways to dispel unfavorable stereotypes and gloomy doomsday predictions.
I think radiology is the future of medicine. It is with enthusiasm that I join the field in order to tackle rising challenges and protect our role as an important entity in the chain of patient care. I look forward to sharing my love for radiology with other medical students. Instead of being bogged down by pessimistic projections, I would like future applicants to see radiology as a promising specialty, full of potential. After all, the best way to predict the future is to help create it.
[[{"type":"media","view_mode":"media_crop","fid":"34963","attributes":{"alt":"","class":"media-image","id":"media_crop_2068659763450","media_crop_h":"0","media_crop_image_style":"-1","media_crop_instance":"3717","media_crop_rotate":"0","media_crop_scale_h":"0","media_crop_scale_w":"0","media_crop_w":"0","media_crop_x":"0","media_crop_y":"0","title":" ","typeof":"foaf:Image"}}]]
Year
Positions
U.S. applicants
Total applicants
Unfilled programs
% Filled, U.S. seniors
% Filled, total
% US grads of matched
2015
999
680
1141
55
58.0
86.3
67.2
2014
1008
803
1288
34
68.9
94.2
73.1
2013
979
865
1307
30
74.0
94.8
78.1
2012
976
875
1219
39
75.9
92.3
82.2
2011
980
940
1299
17
78.9
96.6
81.7
2010
949
1027
1431
2
84.2
99.6
84.5
2009
944
1117
1543
3
86.4
99.3
87.0
2008
928
954
1364
12
81.7
98.0
83.4
2007
902
844
1149
7
79.7
98.1
81.2
2006
882
787
1102
16
80.3
96.6
83.1
2005
884
757
1035
22
77.0
95.6
80.5
2004
855
874
1197
3
80.8
99.4
81.3
2003
843
967
1428
2
82.1
99.8
82.3
2002
788
938
1380
6
83.0
98.5
84.3
2001
738
999
1503
5
82.4
99.2
83.1
Advertisement
Related Content
Advertisement


Advertisement
Advertisement
Trending on Diagnostic Imaging
1
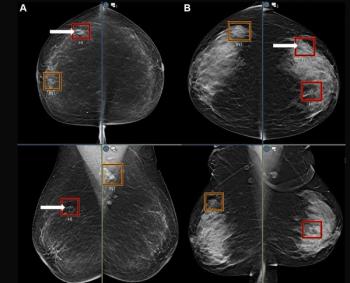
Mammography Study Suggests AI Can Bolster the Ability of General Radiologists to Detect Breast Cancer
2
Study Suggests FDG-PET Better than CT for Assessing Treatment Response for Metastatic Breast Cancer
3
A Closer Look at the Evolution and Emerging Insights with Amyloid and Tau PET for Dementia and Alzheimer’s Disease
4
AI in Neuroradiology: Keys to Workflow Integration, Governance, and Facilitating Improved Outcomes
5