There were also comparable results between the ccLS and m-ccLS wioth respect to differentiating clear cell renal cell carcinoma (ccRCC) and non-ccRCC lesions (88.4 percent vs. 86.8 percent), according to the study authors.
“ … Non-clear cell RCC subtypes, particularly papillary and chromophobe RCCs, often receive lower ccLS scores and may be reclassified by the incorporation of pseudocapsule assessment. This may explain the improved performance of m-ccLS for differentiating benign from malignant renal masses while maintaining similar performance for ccRCC identification,” noted lead study author Umut Asfuroglu, MD, who is affiliated with the Faculty of Medicine and the Department of Radiology at the Gazi University School of Medicine in Ankara, Turkey, and colleagues.
Three Key Takeaways
• Adding pseudocapsule assessment to the ccLS may help separate benign from malignant renal masses. The modified Clear Cell Likelihood Score (m-ccLS) reached an AUC of 77 percent for distinguishing benign from malignant masses, compared with 65.4 percent for the standard ccLS. The authors suggest this may be attributable to pseudocapsule assessment reclassifying non-clear cell subtypes such as papillary and chromophobe RCC, which tend to receive low ccLS scores.
• The modification does not appear to weaken ccRCC identification. The two scores performed similarly for distinguishing ccRCC from non-ccRCC lesions (AUCs of 88.4 percent for ccLS and 86.8 percent for m-ccLS). This suggests pseudocapsule assessment can be added without losing the ccLS's main strength.
• The T2 signal intensity ratio was the most consistent single mpMRI marker. T2 SI ratios were significantly higher in malignant masses than in benign ones (1.10 vs. 0.85) and in ccRCC than in non-ccRCC (1.16 vs. 0.85). This may support the value of the T2 SI ratio as a quantitative adjunct in line with T2 signal being a core feature of the ccLS algorithm.
Is the T2 SI Ratio a Key bpMRI Marker for Differentiating Renal Masses?
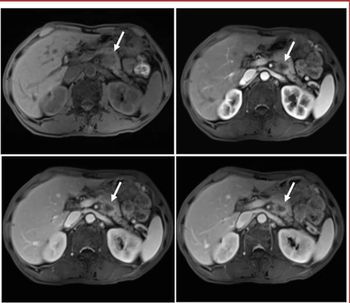
The study authors also noted higher T2 signal intensity (SI) ratios in malignant renal masses in contrast to benign masses (1.10 vs. 0.85). The researchers found the statistically significant difference with the T2 SI ratio was also demonstrated in differentiating ccRCC and non-ccRCC masses (1.16 vs. 0.85).
“Among the evaluated MRI parameters, T2 SI ratio demonstrated the most consistent performance, being significantly associated with both ccRCC identification and benign–malignant discrimination. This finding is consistent with the principles of the ccLS algorithm, in which T2 signal intensity constitutes one of the key imaging features,” added Asfuroglu and colleagues.
(Editor’s note: For related content, see “Emerging CAIX PET Agent Garners FDA Breakthrough Therapy and Fast Track Designations for ccRCC,” “Could the PET Imaging Agent ITM-94 be a Game Changer for Detecting Clear Cell Renal Cell Carcinoma?” and “A Closer Look at New Guidelines for Molecular Imaging of Renal Masses: An Interview with Steven Rowe, MD, Part 1.”)
Beyond the inherent limitations of a retrospective single-center study, the authors acknowledged the relatively small cohort size, the small number of benign lesions and that histopathologic confirmation was not available for all lesions.